Yes, I recognize the deja vu. About one year ago I began reallocating assets to reflect a more inflationary posture. That posture lasted only a few months. Last summer's debt ceiling debate coupled with the EU debacle squelched my incremental inflationary expectations, and I peeled off risk positions in favor of a more balanced posture.
Fast forward to now. Once again I find myself adding long exposure in lieu of a tape that seems to be taking the Fed's "0% till 2014" promise to heart.
Will this action once again prove temporary in a world that's drowning in a debt bubble that wants to deflate? Not sure, but currently my actions need to express a perceived uptick in the odds of Big Inflation on the horizon.
position in SPX
Showing posts with label asset allocation. Show all posts
Showing posts with label asset allocation. Show all posts
Wednesday, February 8, 2012
Thursday, February 2, 2012
Bullish Patterns
Am noticing lots of cup-and-handle patterns in many large cap equity charts. Some of the patterns span a few days while others are multi-month in nature.
Moreover, the action 'feels' bullish. The tape is consistently bid. Weakness is being bought regardless of news.

Feels too risky to be net short here. As such, I've been adding some long side exposure to balance things out. I've been buying some of my fave blue chip names (CSCO, JNJ, PG). Today I added a little commodity exposure via DBC.
To be clear, I'm in 'rent' rather than 'own' mode here. But I want to reposition my near term stance in this bullish tape. I'm now a coupla percent net long.
position in CSCO, DBC, JNJ, PG, SH
Wednesday, February 1, 2012
University Endowment Trends
This paper is somewhat dated (2008), but it still points out interesting trends in university endowments over a decade or so. Note big difference in endowment size between private (especially Ivy) and public. This really sticks out when examining endowment/student.
Asset allocation shows movement out of fixed income in favor of alternative assets. Some stats (medians):
2005 Overall
n = 726
endowment size = $72 million
return = 9%
AA equity = 59.6%
AA fixed income = 20.4%
AA alternative assets = 7.6%
Interestingly, Ivy League AA in 2005 was 38.1% equity/13.0% fixed income/37.1% asset allocation.
Of course, we now know that those increased allocations toward alternative assets were a source of pain during the credit meltdown of 2008-2009. Many alt investments, particularly illiquid ones, were crushed when bid/ask spreads fell thru the floor.
Still, the attractive characteristic of many alternative assets is that they can be less correlated with other asset classes, which makes them useful for diversification purposes.
position in SPX
Wednesday, January 25, 2012
Low Fed Rates till 2014 Sparks Gold
In today's FOMC announcement, the Fed signaled that they will be keeping rates ultra low thru most of 2014. That even raised my eyebrow...
This news put some giddy-up into gold, which vaulted about $50 this afternoon on the FOMC news.

I used this leap to sell my GLD position. It's up about 10% from its lows, price is now filling the gap, and stochastics are getting twisty in the overbought zone.
Am also concerned about the re-hypothecation issues surrounding these metal ETFs on the back of the MF Global situation last fall.
Selling this position puts me just about 0% net long (long metal and ag commodities against short equity index). Feels about right given the current field position of various asset classes.
position in commodities, SPX
Sunday, January 15, 2012
Bullish Pattern Resolution
The bullish reverse head and shoulders pattern forming recently in the equity indexes has indeed resolved to the upside.

The action hasn't been voracious out of the set up, but the tape has a persistent 'buy the dip' tone. Now that SPX 1280 has been cleared, this move technically 'works' to 1360.
I remain slightly net long (long commodity ETFs against short equity index). Should commodities continue to lift with stocks, I'll look to piece out of long exposure and add to my index short.
position in commodities, SPX
Thursday, December 22, 2011
Inverse Head and Shoulders Pattern
Back in early November technicians were eyeing the pennant patterns forming in the major indexes, and largely opining that the resolution of that pattern was likely to be higher. As we now know, the bulls were fooled as prices moved lower.
Now, technicians are eyeing a forming inverse head and shoulders pattern with similar optimism.

Will Hoofy's heros bring home the bacon this time? That seems to be the growing consensus.
Personally, I'm not playing it that way. There is far too much macro overhang for my tastes, not to mention overvaluation at the micro level, to merit holding a bunch of long equity risk.
Am currently about 10% net long, but that long exposure is in commodities. It is offset not quite one for one with an index equity short. This hedged position has not proven to be as effective this time around because of recent weak commodity performance relative to stocks.
Currently, however, my MO remains the same. Use price to my advantage to a) add exposure at lower prices and b) unload exposure at higher prices. All the while, I want to maintain sizeable dry power (read: cash and short term fixed income).
position in commodities, SPX
Wednesday, December 14, 2011
USD Trade Closed
Sold my small UUP call position this am into this morning's spike higher in the dollar.

Resistance is approaching dead ahead. Plus possible double top.
Just tradin' 'em...
no positions

Resistance is approaching dead ahead. Plus possible double top.
Just tradin' 'em...
no positions
Lightly Buying
Buying some gold and silver this am into the continued smeltage. Support is coming up fast. Stochastics getting there as well. Stated differently, risk/reward is getting more attractive.

Nothing crazy, just some incremental adds. Truth be told, would welcome lower prices for more substantial buying.
position in GLD, SLV, CEF

Nothing crazy, just some incremental adds. Truth be told, would welcome lower prices for more substantial buying.
position in GLD, SLV, CEF
Monday, December 12, 2011
Gold Moving Lower
Never got off a comment last week on the head-and-shoulders (bearish) pattern setting up in gold. This morning gold is down nearly $50, which essentially validates the 'dandruff.'

Why the thrust downward in the yellow metal? Not sure, cookie, as there is no 'obvious' gold-related news on the tape. Over the weekend, however, there were some rumblings that last week's EU summit outcomes 'did not go far enough' in resolving the debt crisis. Swap spreads are generally widening today, with Greek spreads crossing the 10,000 bps mark--implying a 100% chance of default.
Am starting to sense that gold may be a leading indicator of another round of 'risk off' in the markets. Added to my short equity position this am, and may do more in the upcoming sessions depending on how things unfold.
position in GLD, SPX
Monday, November 28, 2011
Durable Rally, or Short Term Relief?
If we were to assign news-related causes to today' 2-3% stock market rally, it would probably be a blend of better than expected Black Friday sales plus the spectre of (another) Euro bailout. Of course, we learned today that a) the IMF had no Italian bailout program in motion, and b) last week's retail sales numbers may be greatly exaggerated.
So perhaps today's move is just one more rally to blow off some near term selling pressure.
Technically, an upside move 'works' to SPX 1220.

Other technical evidence, however, is not in synch with a sustained upside move. After an early move lower, Treasuries recovered most of the day's losses. Bank stocks gave up a big chunk of their early gains. The dollar also closed near even after early selling. Oil closed near its lows.
Hard not to view these 'divergences' with some skepticism about the prospects for big upside from here. Time will tell, of course.
Personally, I did a whole lot of nuttin' today. Will likely put back on some of the incremental short exposure ditched last week should prices continue higher toward 1220. Other than that, I continue to be active in the physical metals market, buying both gold and silver.
position in SPX, gold, silver
Wednesday, November 23, 2011
Reducing Short Exposure
Tossed about 20% of my SPX short to the trading gods in respect of the move lower that we've seen. Technically, we're approaching what might be thought of as a 'minor' support level at 1160ish.

More substantial support rests at about 1120ish.
Will look to piece out more short exposure on extended weakness. Will also look to add to my metals exposure should they continue weak as well.
position in SPX

More substantial support rests at about 1120ish.
Will look to piece out more short exposure on extended weakness. Will also look to add to my metals exposure should they continue weak as well.
position in SPX
Monday, November 21, 2011
Flag Pattern Resolved
Last week's question about which way the pennant pattern in major market indexes would break has been answered. The pattern has resolved to the downside.

The reason being assigned to the rhyme this morning is the budget supercommittee's (gotta like that term) failure to come to an agreement over $1.2 trillion in spending cuts. No deal inked by Wed means across-the-board cuts of like amount commencing in 2013.
This sets up the 2012 elections as a referendum on Big Govt.
Of course, other issues are weighing markets as well. Europe is still on fire, and fallout from the meltdown of MF global is wreaking havoc in commodity markets.
Personally, am leaning slightly net long--about 5-7% of liquid assets. In other words, the value of long positions (primarily commodities) outweights the value of short positions (SPX index short) by a small amount.
Should stock slippage continue another 30 SPX handles or so, I'll start looking to cover some of my short position (support resides in SPX 1120-1140 range). With precious metals getting slapped around today (gold and silver both off 3-4%), am itching to add to those positions as well.
positions in SPX, gold, silver
Tuesday, November 8, 2011
Bullish Silver Pattern
Silver appears to be tracing out a cup and handle-ish pattern. Added to my SLV position this am and may add a bit more around here.

Should SLV start to 'fill the gap' precipitated by the mid Sept meltdown, then a trade 'works' to 38ish.
position in SLV

Should SLV start to 'fill the gap' precipitated by the mid Sept meltdown, then a trade 'works' to 38ish.
position in SLV
Sunday, October 30, 2011
Ags Look Interesting
Have been adding to my agricultural commodity position (RJA) over the past few days. From a technical standpoint, looks like a multi-month reverse head-and-shoulders to me w/ a gap directly above (gaps tend to be magnets for price).

From a fundamental/macro standpoint, we've waxed about the bullish set-up in commodities before (dollar heading to dust, capacity not keeping up w/ demand, gov't policies that favor famine).
As such, I'm digging this for the long side of my hedge book.
position in RJA

From a fundamental/macro standpoint, we've waxed about the bullish set-up in commodities before (dollar heading to dust, capacity not keeping up w/ demand, gov't policies that favor famine).
As such, I'm digging this for the long side of my hedge book.
position in RJA
Thursday, October 27, 2011
Making Sales
Sold most of my Cisco (CSCO) position. Did some yesterday and then lion's share this am into the EU bailout euphoria. Will keep a small 'core' position bought at much lower levels. I do think that the stock reflects decent value here but I also think chances of buying it much cheaper in the next few months are good given the macro set-up.
After the sale, my overall risk position is pretty much hedged. My remaining position in CSCO coupled with some commodity exposure (GLD, SLV, RJA) is offset nearly one for one by an index equity short (SH).
If prices continue to rip higher from here, then I might sell of bit of commodity exposure or add a bit to my index short. If prices reverse lower from here, then I might add some more precious metal exposure or shed some of my short position.
Meanwhile I wanna sit back and observe for a while.
position in CSCO, GLD, SLV, RJA, SH
Monday, October 24, 2011
More Resistance Overhead
Markets continue to gear higher. The SPX is now up 17% from the early Oct lows. Can it continue? Sure, markets can do anything they want, cookie.

The technicals suggest some stiff resistance dead ahead in the 1260ish area. Many of the stochastic oscillators are starting to 'pretzel' in overbought zones on a daily basis.
I for one have resumed hedging mode, adding some index shorts (SH) against my equity (CSCO) longs. I have trimmed a bit of CSCO but hope to do much more into any further strength.
Have also been adding some GLD and ultimately would like that to represent the lion's share of my long side exposure here.
Right now I'm 7-8% net long. I hope to be 'delta neutral' in the near future. Long some CSCO and GLD paired against an index short.
position in CSCO, GLD, SH
Friday, October 14, 2011
Minding the Gap
Bought some DBC early last week when prices were falling into the abyss. My thought was that if markets reversed higher, then this might be good for a trade up to about $28.
Why $28? Because once prices broke below that level last month, $28 defines a formidable resistance level. In the context of technical analysis, resistance defines a price level likely to retard further price advances due to the presence of latent supply--such as all those people who bought around $28 early last month and are now trying to get out at a price that lets them come close to break even. Short sellers may also lean on this level and sell come shares short with tight defined risk (i.e., if prices go north of $28, then shorts consider that as an indicator that this was a bad trade, and subsequently stop themselves out).

Moreover, gaps similar to the one that reflected the price breakdown in mid Sept often serve as magnets if/when prices retrace. Indeed, there's a saying among technicians that 'all gaps are meant to be filled.'
To add one more tidbit of rationale to my DBC sale, short term stochastics (e.g., the MACD shown above) were looking pretty toppy, suggesting an 'overbought' condition in the near term. Markets tend to ebb and flow between optimism and pessimism on multiple time frames; presently we may be approaching an excess of optimism in the near term.
As such, when DBC lifted into the gap area today, it was time for me to go.
no positions
Wednesday, October 12, 2011
Resistance at SPX 1220
The steep rally that we've been experiencing was repelled in an assualt of SPX 1220ish today. This resistance has been a line of serious upside contention over the past 2-3 months (just as 1120 had been on the downside).

Best case for the bulls would be to do work underneath resistance for a few days--both to work off overbought conditions and to chew through latent supply.
I for one have started building a short side hedge again and added to it near 1220. I plan to increase this hedge as well as make some sales in CSCO should the stock continue to trade higher. Would prefer to get more balanced here.
Gun to head has me thinking they go higher from here, but given the macro state of the world, the opposite would not surprise me.
position in CSCO, SPX
Tuesday, October 11, 2011
Technical Crossroads for CSCO
Since last Tuesday's late day reversal, stock markets have been on fire, with the SPX rallying about 120 handles from last week's lows.
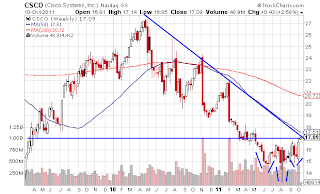
Cisco (CSCO) has been showing good relative strength during the rally. It is now facing an importantly level technically as it is challenging the intermediate downtrend line. A break out here suggests a measured move into the $18-19 area.
A bullish factor in CSCO's favor is the reverse head and shoulders pattern that has been tracing out over the past few months. Price is currently trying to puncture the neckline at $17ish which, ironically, defines the downtrend resistance as well.
Next few days should provide some insight on whether CSCO can power over the hump.
position in CSCO, SPX
Tuesday, October 4, 2011
Late Day Reversal
Markets continued to sink on the opening bell this am. An hour or two into the day, I felt a tinge of remorse after unloading my short position yesterday.
Weakness continued until late in the day, when chatter surfaced that the European officials were creating a 'bad bank' entity to dump troubled securities tied to the sovereign debt crisis in the EU. In the final 45 minutes of the trading day, markets went from being down 1.5% to being up 2%. The SPX recaptured the 1120 level and had nearly a 50 handle intra day range.
Naturally, any remorse still pulsing thru my veins suddenly vanished.

Coupled with reclaiming previous support, the long tail pattern on the charts suggests a 'flush' and perhaps a near term low. Add to that my growing sense that sentiment was getting pretty ugly (e.g., I got a call last night from a distraught friend who was down big and wanted to sell all of his stocks), and perhaps we have the makings of a durable rally.
I do know that I'm in no hurry to re-engage on the short side right now. Would rather sit back and observe for a bit.
Did nibble on some DBC this am as commodities have been getting hammered and many are sitting on technincal support.
position in DBC
Subscribe to:
Posts (Atom)