Jim Grant sees some value in large cap stocks like Cisco (CSCO) and Johnson & Johnson (JNJ). Generally, however, he sees most asset classes as richly priced.
He suggests that one investment strategy in the current environment is to simply hold cash, because the opportunity cost associated with not being in T-bills and other short term instruments is 'not much.' Although you make next to nothing on the cash, it is available when other asset classes become more attractively valued. Overvaluation, he observes, often 'passes in a thunderclap' and those who are liquid can 'get fully invested in a comfortable way.'
This strategy has made sense to me for some time. I find it interesting coming out of Jim Grant's mouth because of his inclination toward inflationary macro scenarios. What he is describing his more consistent with what happens in a deflationary situation. After all, why hold cash if you think its value will be inflated away.
Currently my cash level is just over 50%. I wouldn't mind bumping this to the 60-70% range, and will be looking to sell strength to do so.
positions in CSCO, JNJ
Saturday, May 28, 2011
Wednesday, May 25, 2011
SLV Trade Closed
Exited my three week old SLV trade on today's strength. A couple of adds to the position as the security leveled out in the 32-35 range helped this trade along.
Perhaps SLV will continue higher on a quest to fill the gap at 38ish. This level also coincides w/ the 50 day moving avg.

But my time horizon on this trade was shorter term, and I was fortunate to be able to sell into strength today.
While the volatility has declined somewhat, this was still one one of the jumpier positions that I've held in a while. Hard to imagine folks trading this thing w/ leverage.
no positions
Tuesday, May 24, 2011
Deflation Definition
During his CFA speech, Grant offered a definition of deflation that I had not quite considered before. He argues that deflation is not simply falling prices. After all, prices are likely to fall in unhampered markets as productivity increases. Higher productivity means greater abundance. More supply of economic resources per monetary unit means lower prices.
Stated differently, lower prices are natural outcomes of free markets.
Instead, Grant suggests that deflation is 'too little income chasing too much debt. It is a disorder of lending and borrowing.'
He notes that in a credit crisis, inventories (whether they be hard goods or securities) cannot be financed and therefore are thrown on the market. Prices broadly fall as a consequence.
Deflation, therefore, is not the Wal-Marts (WMT) and tech hardware industries of the world getting more efficient. Rather, deflation is excess credit leaving the system.
What's particularly new and vivid to me about Grant's explanation is the notion of inventories of all sorts being thrown on the market because they cannot be financed.
When you hear market watchers gasp that 'they're selling anything that isn't nailed down,' deflation is likely at hand.
no positions
Red to Gold
Another remark on Grant. In his 5/20 letter, Grant reprints a speech he gave at the CFA annual meeting in early May in Scotland. In it, he builds the case for the Chinese 'red capitalism' being an exaggerated version of the hampered market model practiced in the US.
He suggests the situation in China as a 'description, writ large, of the salient error of all the world's monetary arrangements--namely the elevation of the technique of command and control over the free interplay of supply and demand.'
Grant then makes the case for the gold standard as a means for putting markets back in control.
position in gold
Monday, May 23, 2011
China's Banks
Jim Grant is one of my favorite reads. His newsletter, Grant's Interest Rate Observer, is a bit out of my price range but I'm fortunate to score an issue every now and then.
His May 20th newsletter discusses troubles under the hood w/ China's banking system. While China's markets and massive growth have been all the rage, people seem to forget that a socialist regime oversees the country. Central planners control capital allocation on a macro scale. When bureaucrats sitting in a room are deciding how to allocate capital, they are likely to make more mistakes of longer duration than individuals making decisions in unhampered markets.
Grant suggests that Chinese banks are holding gobs of non-performing loans--loans that banks were required to take on per govt officials. These loans are currently not marked anywhere close to market.
This situation, of course, is reminscent of the credit crunch faced by banks in the US. Grant suspects that, because the Chinese system is so opaque, the potential exists for big problems if things start to go bad.
His 'new working hypothesis is that the banks of the People's Republic...will execute the greatest belly flop in the history of paper money.'
Should this come to pass, there is no way that the problem would be contained to China.
Thursday, May 19, 2011
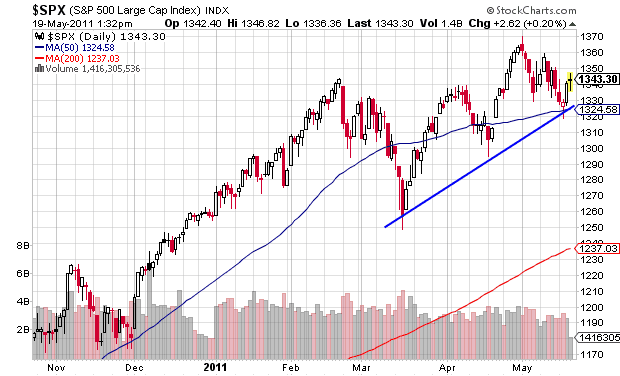
Selling Strength
Am moving into 'sell strength' mode in my personal accounts. While I believe that there is some value in select large cap stocks, there are just too many negative factors that, in my view, serve as headwinds against higher prices here.
Beyond the myriad macro factors (debt, EU, Mid East, etc), overall metrics suggest conditions of extreme stock market valuation. Couple that with the pending end of QE2 and one has to wonder what will keep stock prices levitating at nosebleed levels.
I have therefore been trying to use price to my advantage to unwind some risk. Sold positions in Intel (INTC) and Merck (MRK) yesterday. On further strength, will likely do same for Johnson & Johnson (JNJ). All of these stocks have had nice 15-20% moves off their spring lows and are trading near the upper end of technical band tags.
Should the price action in Cisco (CSCO) and Microsoft (MSFT) strengthen, I may make some partial sales here as well although I still perceive some value in these names. Currently, however, neither of these stocks can get out of their own way--which may be telling in and of itself.
If commodity prices strengthen, then I will likely lighten up on a number of related ETFs although I plan to retain a core position in the SPDR Gold Trust (GLD).

Hard not to eye the action in the general indexes without wondering whether we're putting in a significant top. First near term confirmation of such in the SPX would be a decisve break of the multi-month uptrend line (1330ish).
positions in CSCO, MSFT, GLD, SPX
Beyond the myriad macro factors (debt, EU, Mid East, etc), overall metrics suggest conditions of extreme stock market valuation. Couple that with the pending end of QE2 and one has to wonder what will keep stock prices levitating at nosebleed levels.
I have therefore been trying to use price to my advantage to unwind some risk. Sold positions in Intel (INTC) and Merck (MRK) yesterday. On further strength, will likely do same for Johnson & Johnson (JNJ). All of these stocks have had nice 15-20% moves off their spring lows and are trading near the upper end of technical band tags.
Should the price action in Cisco (CSCO) and Microsoft (MSFT) strengthen, I may make some partial sales here as well although I still perceive some value in these names. Currently, however, neither of these stocks can get out of their own way--which may be telling in and of itself.
If commodity prices strengthen, then I will likely lighten up on a number of related ETFs although I plan to retain a core position in the SPDR Gold Trust (GLD).
Hard not to eye the action in the general indexes without wondering whether we're putting in a significant top. First near term confirmation of such in the SPX would be a decisve break of the multi-month uptrend line (1330ish).
positions in CSCO, MSFT, GLD, SPX
Saturday, May 14, 2011
Low Bond Yields in an Inflationary World?
One phenomenon that is perplexing many who believe in the Big Inflation thesis is the behavior of bond markets--particularly government bond markets. Theory says that yields should go up with inflationary expectations. People should be selling bonds today out of worries that the real value of their bonds will go down as their coupons get paid back in dollars that are lower in value.

That theory has not been working out well in practice. Despite the $trillions created by the Federal Reserve over the past couple of years, and commodity prices screaming higher, long bond yields have not gone to the moon as many inflationistas have forecast.
Perhaps the theory doesn not account well for the dynamics of transitionary periods.
For more than two decades, central banks have been suppressing interest rates and offering credit on the cheap. This credit has gone into all kinds of risky assets--stocks, commodities, real estate, plants and equipment. Bonds are also a risky asset class although they are often perceived as less risky than other categories. This is particularly true of bonds issued by the US government.
The easy credit spawned a secular boom in leveraged risk taking. Individuals, organizations, and governments have all borrowed at low interest rates and invested in assets deemed to return something more than the cost of carrying the loan. This behavior is also known as the carry trade.
Leverage magnifies returns when prices are going in your direction. A few years back people could buy a $500,000 house with little money down and low interest rate, and flip that house a year or two later for $750,000, generating an enormous return over the cost of carry.
As many have discovered over the past couple of years, leverage magnifies losses as well. When firms like Bears Stearns and Fannie Mae (FNMA) were levered 30:1 or higher in mortgage related derivatives, it did not take much decline in home prices before their assets were less than liabilities, creating conditions of insolvency.
In leveraged systems, falling prices motivate many to close out their carry trades. Risky assets are sold, dollars are bought back, and loans are paid off. We saw, and continue to see, a lot of this since 2007-2008.
But not all carry trades are taken off. Some leveraged investors, rather than totally getting out of risk, merely substitute less risky assets. Thus, rather than using credit to buy stocks, carry traders buy bonds instead. Leverage is still in the system, but it is located in assets classes deemes 'less risky.'
One explanation as to why bond yields have not yet backed up is that much leverage remains in the system. Carry traders are content to earn the spread between nearly 0% borrowing cost from the Fed and ten year T-notes paying 3.1%.
But this is a transitory situation. Huge amounts of leverage cannot last forever. Central banks can seek to force spreads open but over time they must collapse as resources borrowed from the future are paid back (or defaulted upon). Short rates will rise and/or returns on risky assets will fall and the carry trade spread will be crushed--regardless of government intervention to the contrary.
At some point, then, we may witness another counterintuitive situation as markets rebalance. It does not seem out of the realm of possibility that bonds could sell off big-time as more and more leverage leaves the system.
position in SH
Sunday, May 8, 2011
Falling Treasury Yields
Perhaps a key tell that the commodity-driven inflation trade was on borrowed time was Treasury yields. After threatening to break higher a couple months back, ten year yields flipped over and have been heading lower.

Yields have now fallen to the 3.1ish level--an area that has frequently found support since 2009. If yields can't get traction around here, then there is not much support till down around 2.5%.
Since lower bond yields often correspond to increased risk aversion among market participants, one has to be conscious about what bond yield trends might be forecasting about the direction of stock and other risky assets prices.
position in SPX
Friday, May 6, 2011
Oil Spill
The wild action in silver yesterday spilled over into commodities at large. It was pretty much chaos across the entire space. The CRB index itself was down about 5%.
Silver wound up getting smoked for 10% yesterday. That's a lot, but it's not super unusual for the commodity known as White Lightning.

More surprising was the move in crude, which was also down 10%. That's a big move for oil. On the week Texas Tea was down about 14%.
Technically speaking, there may be minor support for oil around these levels, but major support defined by the move off the 2009 lows rests at 90ish. I've been buying lightly around here and will probably look to get more aggressive if that 90 level actually shows up.
Although commodities were certaintly due for a correction, moves of this magnitude usually happen for a reason. Unfortunately, that reason is often not apparent until it is too late to act. What market participants need to be wondering is what situation(s), macro or otherwise, might this bearish price action in commodities be forecasting?
position in silver, oil
Thursday, May 5, 2011
White Lightning
Parabolic prices attract traders like flames attract moths. The effect is often the same as well.
The past few weeks saw silver prices go vertical. Last week they touched levels not seen since the Hunt Bros episdoe in 1980. Recently, volume on the ishares Silver Trust ETF (SLV) has been eclipsing volume in the SPDR S&P 500 ETF (SPY).
Over the past 4 days, prices have reversed hard. Silver is down about 25% in four days. Part of this can be attributed to margin requirement increases for trading silver contracts on futures exchanges. A more likely rationale, however, is that silver prices experienced classic trend exhaustion.

An old trading saying goes 'Don't catch a falling knife.' Despite the warning, I'm taking a stab (pun) at SLV from the long side as there appears to be some technical support around the $36 level. More significant support lies below in the $30-32 area which may be the place for a serious position if/when.
This is a classic 'fast market' right now, and trading it is not for the faint of heart. Silver didn't earn its White Lightning monicker by accident...
position in SLV, SPX
Wednesday, May 4, 2011
Real Household Income
Interesting chart showing the disposable income. Over the past decade, real income has basically gone nowhere for the median household.

'Real' income means that it has been corrected for changes in the CPI. For example, if your salary increases by 5% but the prices of goods and services also increase 5%, then your 'real' income in terms of purchasing power has not changed.
There is a fair amount of evidence that the goverment is under reporting the CPI and has been for many years. Some estimates suggest that if we compared apples to apples with older methodology, the CPI is increasing at triple the currently reported rates.
If that it true, then what is the real trend in real disposable income over the past decade?
Sunday, May 1, 2011
What Could Stop the Presses?
After last week's dovish guidance from the Fed in the face of rising commodity prices, it is now very hard to imagine what would drive policy makers to stop the monetary printing presses, or even to slow them down. Of course, it is precisely these types of situations that require investors to make sure they see the other side of the trade.
Markets are seemingly looking thru every crisis (e.g., EU) and discounting the government bailouts that would likely follow.
Still, I can conjure a couple of situations, in my view not well discounted by markets, that might give policymakers cause for pause. Both of them are scenarios in which commodity prices experience a dramatic increase in prices--perhaps extreme enough that policymakers are forced to rethink their approach.
One scenario is a significant upward revaluation of the yuan. US bureaucrats have been hounding Chinese officials to quit 'manipulating' their currency (obviously US officials are not against the pot calling the kettle black). There was some chatter on trading desks last Friday that China may in fact be preparing for a yuan revaluation.
Washington should be careful for what it wishes. Revaluation would mean that the yuan would strengthen against the dollar, which would of course would hammer USD purchasing power. The Dollar Index is already approaching all time lows. Lower dollar means higher commodity prices.
The other scenario relates specifically to oil. This weekend, prices at the pump here in Ohio are said to average $4.11/gallon--an all time high that surpasses the summer oil 2008 spike.

It's hard not to look at the above chart of oil and think 'bullish.'
Should oil prices continue their upward march, and particularly if prices head into a parabolic frolic like gold/silver, there is likely some level where the economy cries uncle.
Higher oil prices is the situation I currently find most likely to force the Fed's hand.
position oil, gold, silver
Subscribe to:
Posts (Atom)